From Website to a Measurable Conversion System
System Architecture //
1. Project Overview
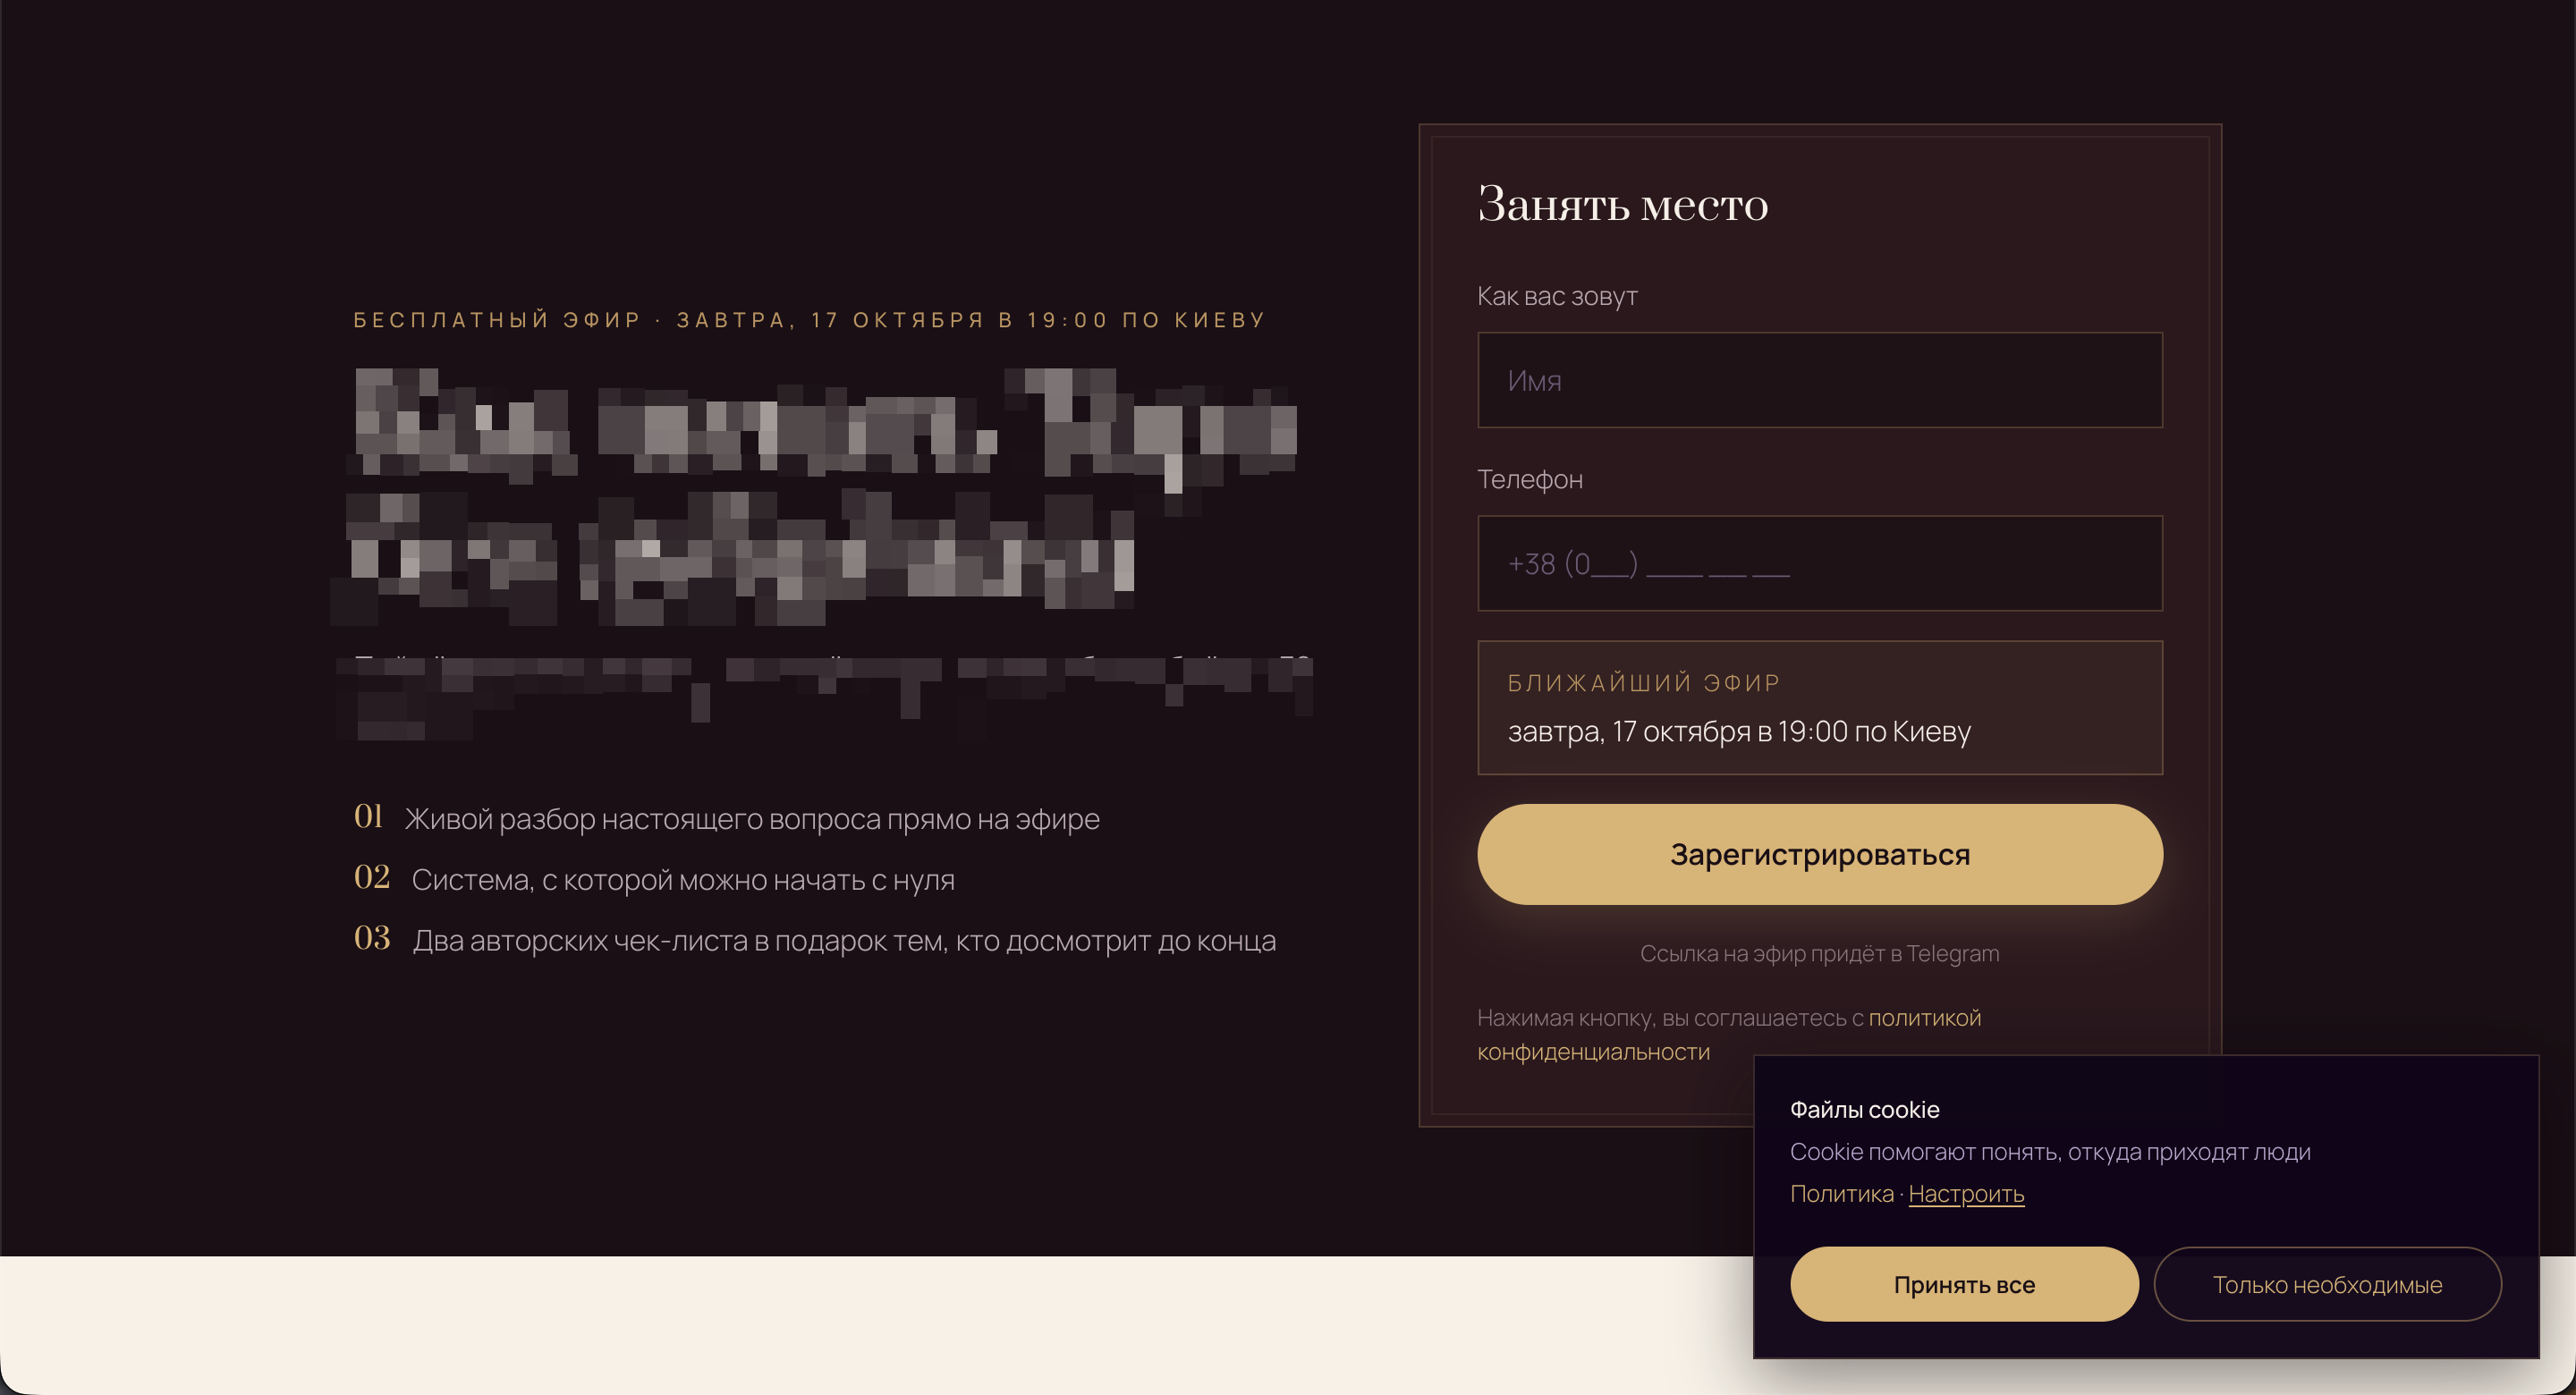
The project began as a simple website for acquiring an audience from advertising, but quickly became the entry point to a complete funnel: first contact, registration, messenger follow-up, booking, payment and subsequent communication had to work as one system
My role covered the frontend redesign and rebuild, UX architecture, mobile-first implementation, form and payment integrations, consent-aware analytics, event modelling and an internal dashboard for advertising and commercial performance
2. The Challenge
3. Solution and Delivery
Redesign and conversion path
The website was fully redesigned and rebuilt as a mobile-first product with a deliberate path from the first screen to the target action. Content, proof points, forms and CTAs were organised around one scenario rather than a collection of disconnected pages
Analytics layer
I connected advertising traffic, the website, registrations, forms, bookings, payments and follow-up communication. Events were consent-aware, with the key actions reduced to clear signals: sign up, submit form, outbound click and order success
Operational visibility
The dashboard brought spend, leads, bookings, payments, revenue, CPL, CAC and ROAS into one operational view. The team could see more than traffic: they could follow the full path from acquisition to commercial outcome
4. Verified Results
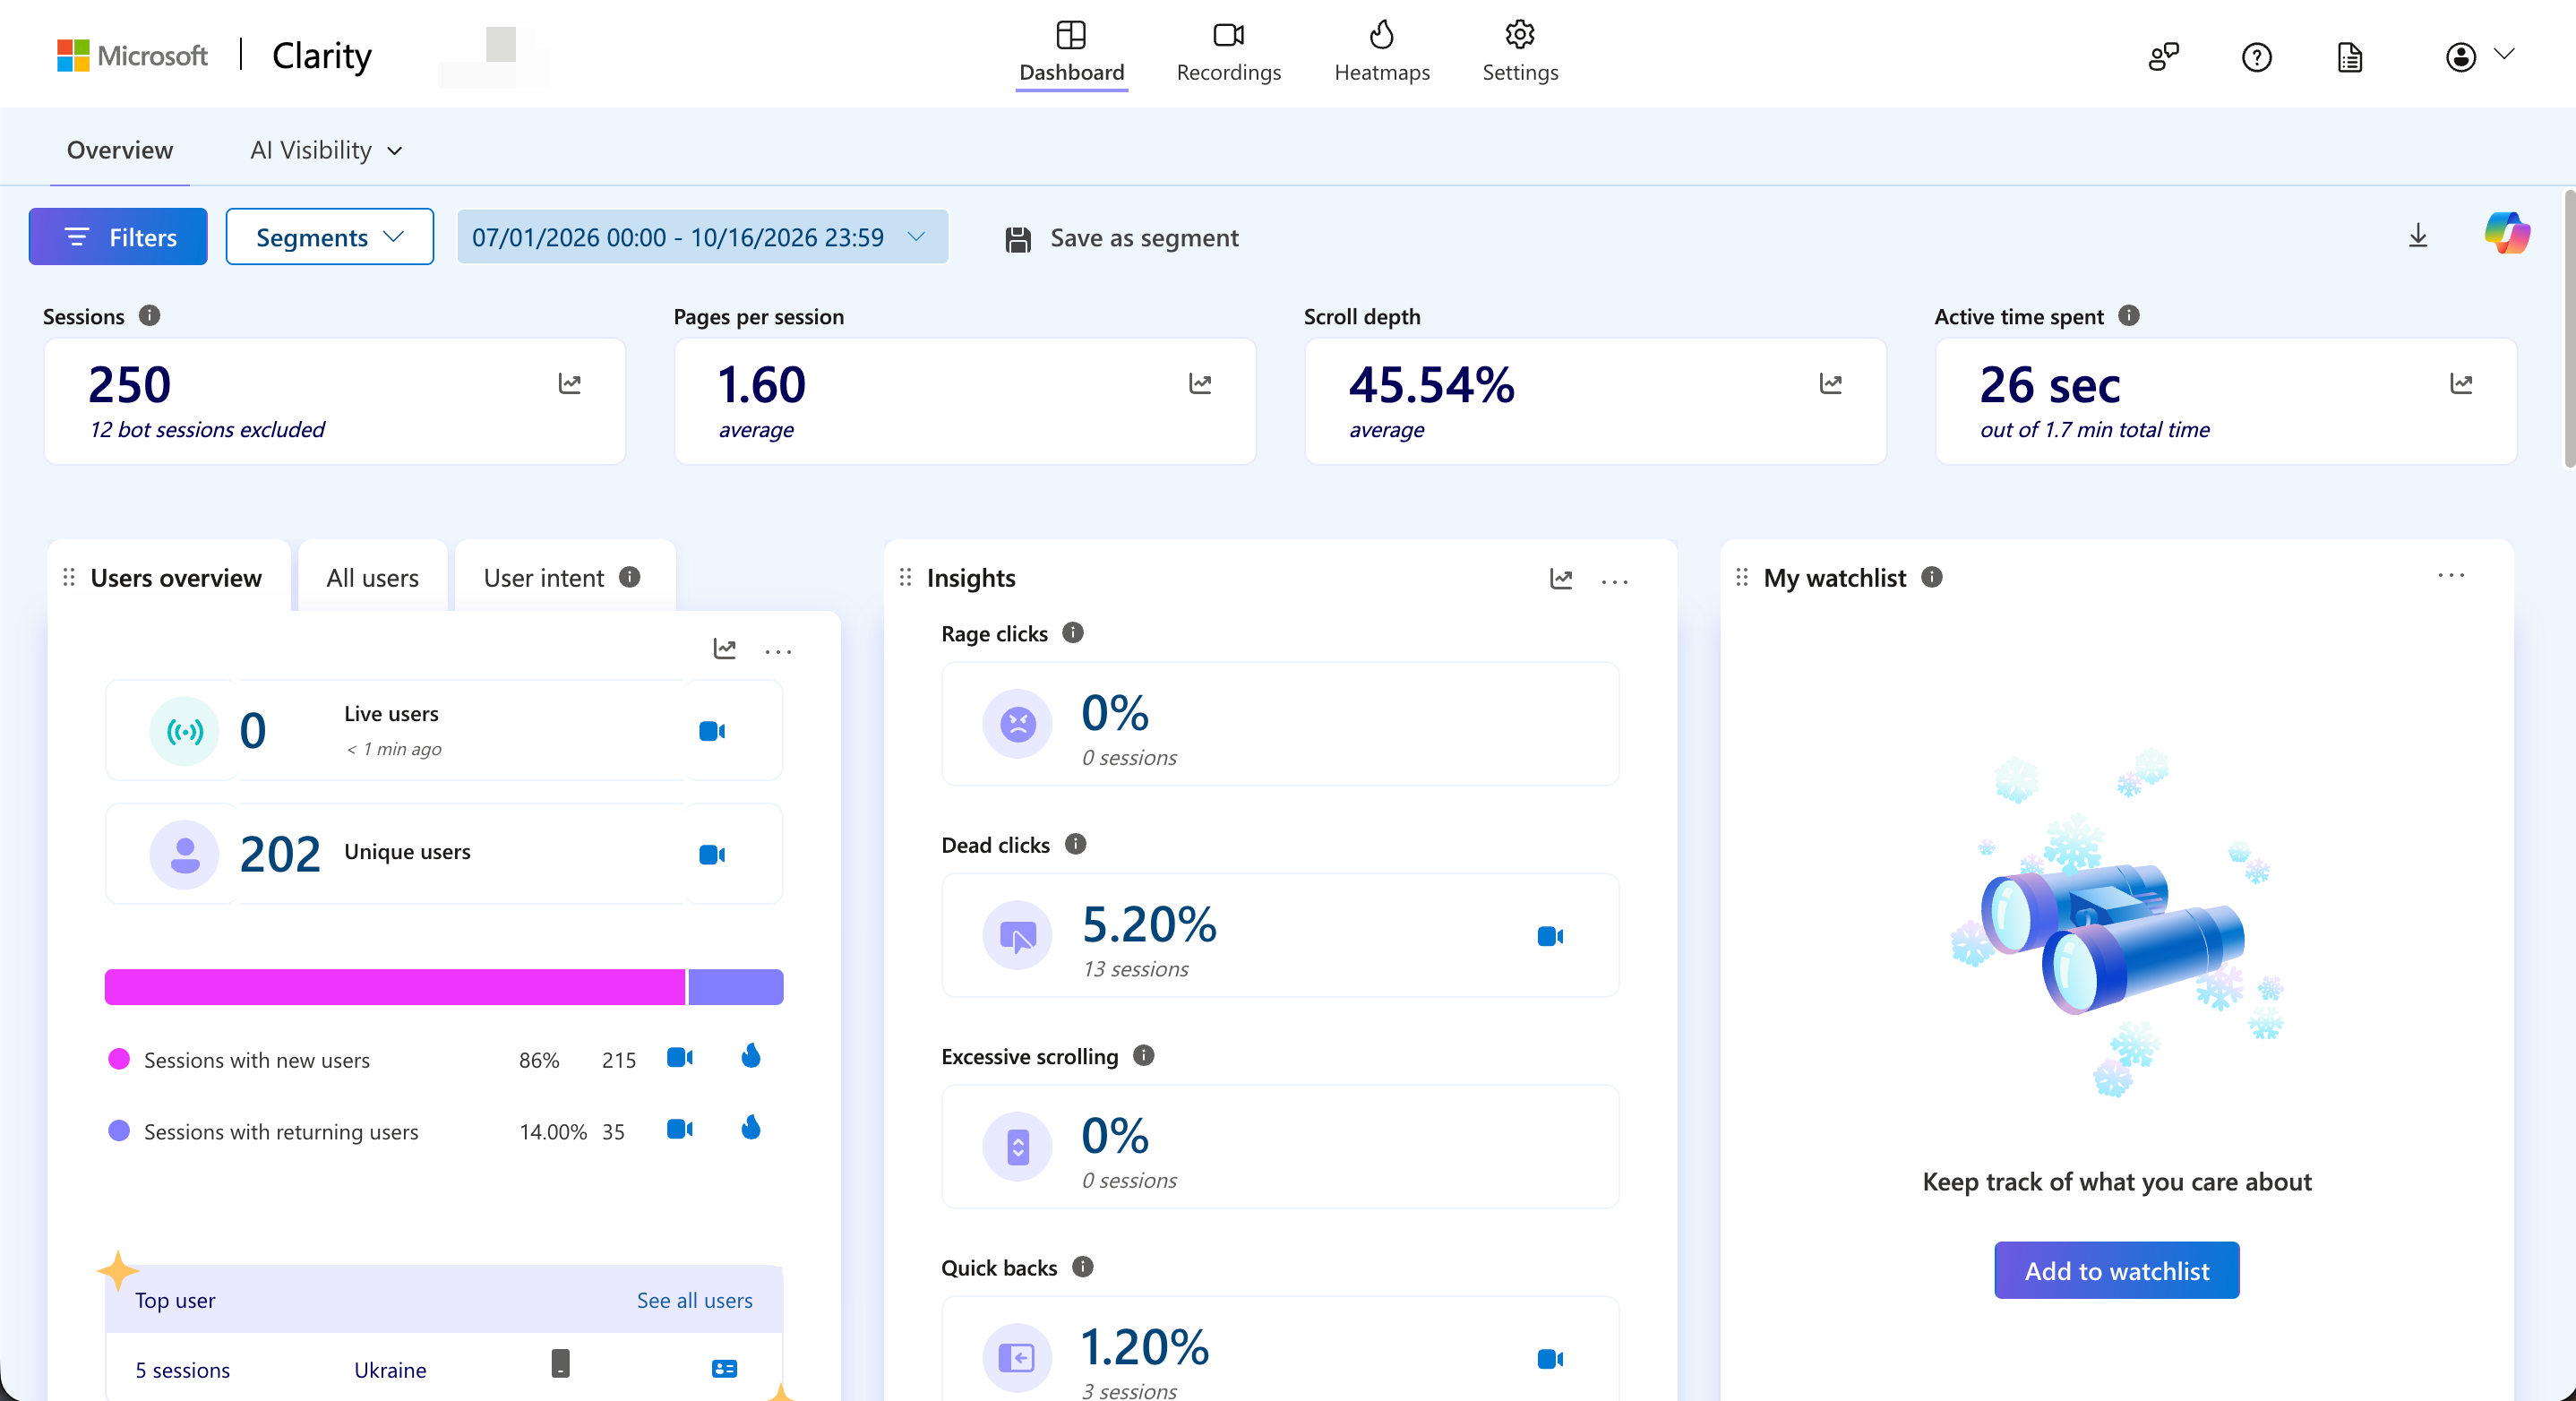
From 1 July to 16 October, the analytics recorded 250 sessions and 202 unique users. Visitors viewed 1.60 pages per session on average, reached 45.54% average scroll depth and spent 26 seconds of active time on average
For the main page scenario, a separate segment recorded 202 sessions, 169 new users and 83 order success events. It also captured 81 sign ups, 79 form submissions and 63 outbound clicks
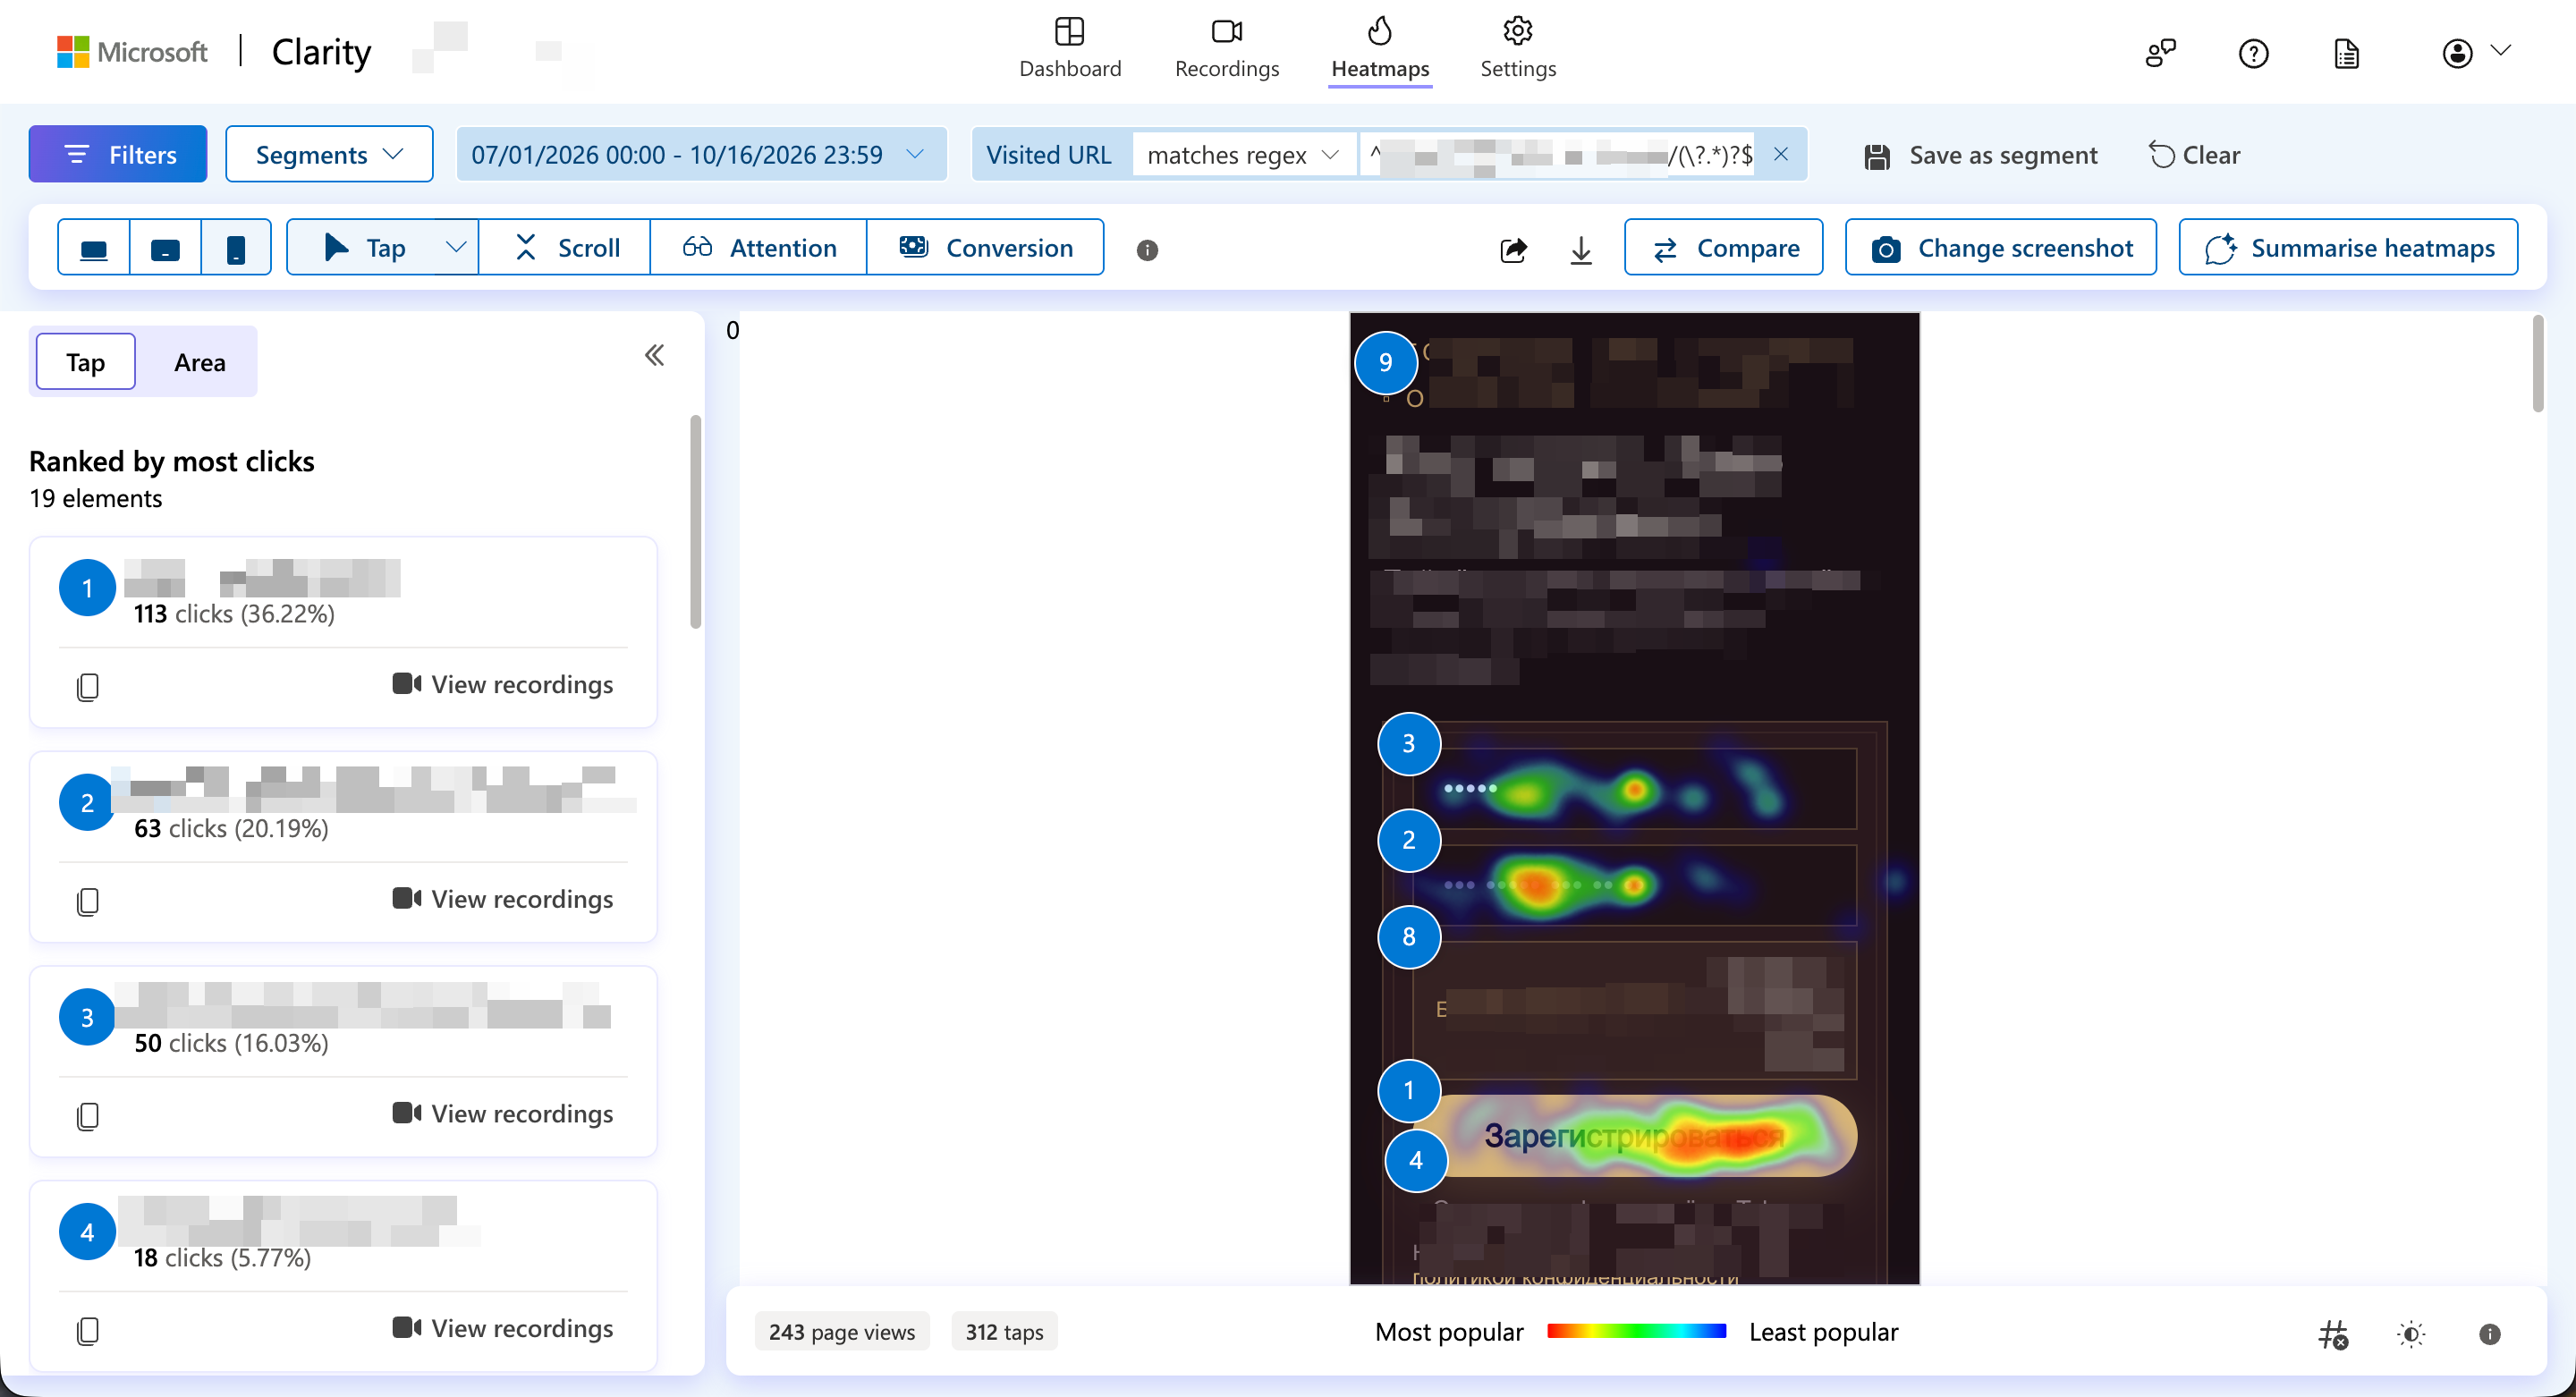
The mobile heatmap recorded 113 clicks on the primary CTA, turning the first-screen decision into a measurable part of the funnel rather than a design assumption
5. Technical Outcome
The system now has a controlled frontend, coherent booking and payment flows, consent-aware tracking and an analytics layer connecting user behaviour with leads and sales. The main page reached a 83/100 performance score, with 2-second LCP and 0 CLS
This was not just a website redesign. I turned advertising traffic and separate touchpoints into a measurable conversion system that shows what works, where users decide and how that movement reaches a sale